 English
  Русский
 Bahasa Indonesia
 Bahasa Malay
 ไทย
ไทย Español
 Deutsch
 Български
 Français
 Tiếng Việt
 中文
中文 বাংলা
বাংলা हिन्दी
 Čeština
 Українська
 Română

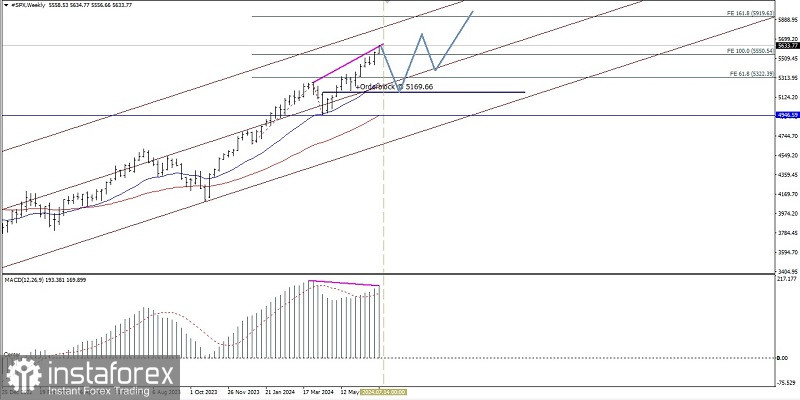
Even though on the weekly chart the S&P 500 index still appears to be dominated by Buyers, this is indicated and confirmed by the price movement of #SPX which moves harmoniously in an upward channel and the price movement is above the EMA 20 & EMA 50, but with the appearance of deviations between price movements #SPX which makes higher-highs in its price movements while the MACD indicator makes higher-lows on the contrary, so in the next 1 to 2 weeks it has the potential to be corrected and weakened down to level 5322.39, but as long as the weakening correction does not penetrate below level 4946.59, this index will still has the opportunity to strengthen again to level 5919.63.
(Disclaimer)