Overview:
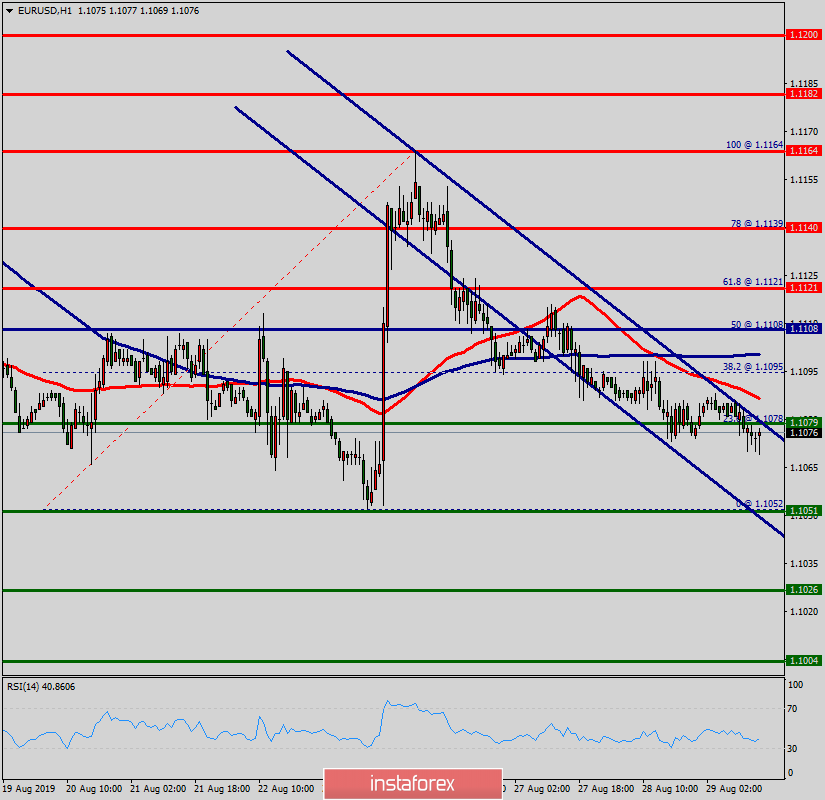
The level of 1.1108 represents a daily pivot point for that it is acting as major resistance/support this week. The major level sets at the price of 1.1108.
The EUR/USD pair faced strong resistance at the level of 1.1108 because support became support.
So, the major resistance is placed at 1.1108. This would suggest a bearish market because the moving average (100) is still in a positive area and does not show any trend-reversal signs at the moment.
The trend is still showing weakness below the moving average (100).
The market is indicating a bearish opportunity below 1.1108. Thus, it will be good to sell at 1.1108 with the first target of 1.1051 so as to test the double bottom.
It will also call for a downtrend in order to continue towards 1.1026. The daily strong support is seen at 1.1026.
The stop loss should be located above the level of 1.1140 (resistance 2).
 English
 Русский
 Bahasa Indonesia
 Bahasa Malay
 ไทย
ไทย Español
 Deutsch
 Български
 Français
 Tiếng Việt
 中文
中文 বাংলা
বাংলা हिन्दी
 Čeština
 Українська
 Română

