 English
  Русский
 Bahasa Indonesia
 Bahasa Malay
 ไทย
ไทย Español
 Deutsch
 Български
 Français
 Tiếng Việt
 中文
中文 বাংলা
বাংলা हिन्दी
 Čeština
 Українська
 Română

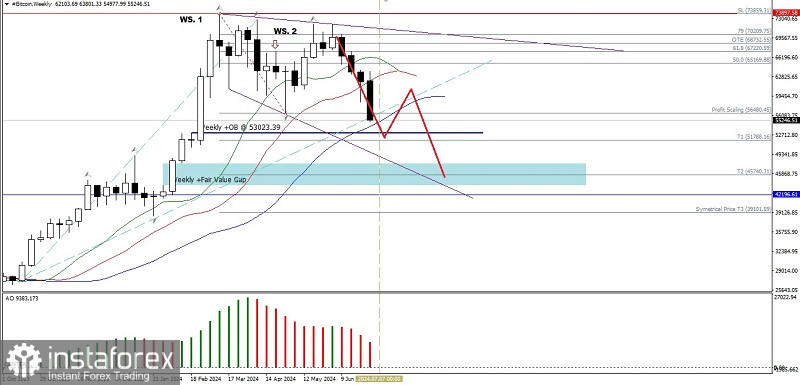
If we look at the weekly chart of the Bitcoin cryptocurrency, we can see the appearance of the first Wiseman signal, Bearish Divergent Bar, which also happens to have formed an angle between the Alligator and its price movement, followed by the appearance of the second Wiseman signal. Super Awesome Oscillator gives a strong confirmation signal that Bitcoin is being corrected down. down, which is currently trying to test the 53023.39 level. If this level is successfully broken, Bitcoin will try to test the level of the Weekly Bullish Fair Value Gap area 51890.40-43865.12, but please pay attention to the appearance of the Descending Broadening Wedge pattern, there is potential for it to strengthen again, especially if Bitcoin succeeds in breaking above the 63801.33 level, then all ongoing weakening scenarios will become invalid and automatically cancel itself.
(Disclaimer)