 English
  Русский
 Bahasa Indonesia
 Bahasa Malay
 ไทย
ไทย Español
 Deutsch
 Български
 Français
 Tiếng Việt
 中文
中文 বাংলা
বাংলা हिन्दी
 Čeština
 Українська
 Română

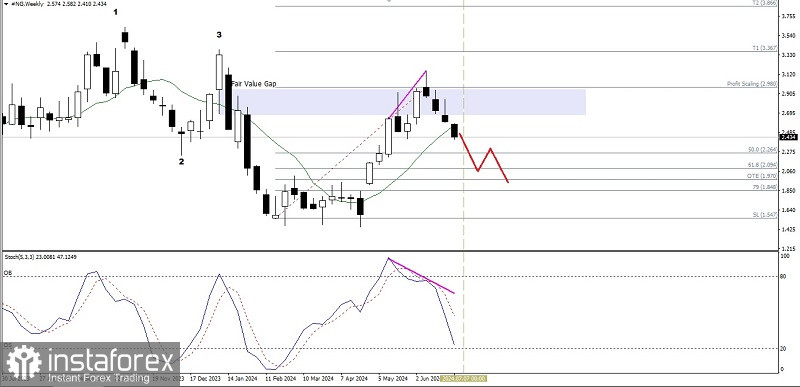
If we look at the weekly chart of the Natural Gas commodity asset, several interesting things can be seen, firstly the appearance of the Bearish 123 pattern, secondly, the restraint of the strengthening movement of #NG at the level of the Bearish Fair Value Gap area which acts as a Supply/Resistance area which is strong enough to make this commodity asset return. weakening and the third is confirmation of deviations in the price movement of #NG which makes a higher High but the Stochastic Oscillator indicator on the contrary forms a Higher Low so based on the three facts above in the next 2 weeks #NG has the potential to continue its weakening where the level of 2,264 will be tested if there is no correction. especially significant, the strengthening correction that breaks above the 3,187 level, then #NG will continue its weakening to the 2,094 level and if the momentum and volatility are supportive then the 1,970 level will be the next target that will be tried to be tested.
(Disclaimer)