 English
  Русский
 Bahasa Indonesia
 Bahasa Malay
 ไทย
ไทย Español
 Deutsch
 Български
 Français
 Tiếng Việt
 中文
中文 বাংলা
বাংলা हिन्दी
 Čeština
 Українська
 Română

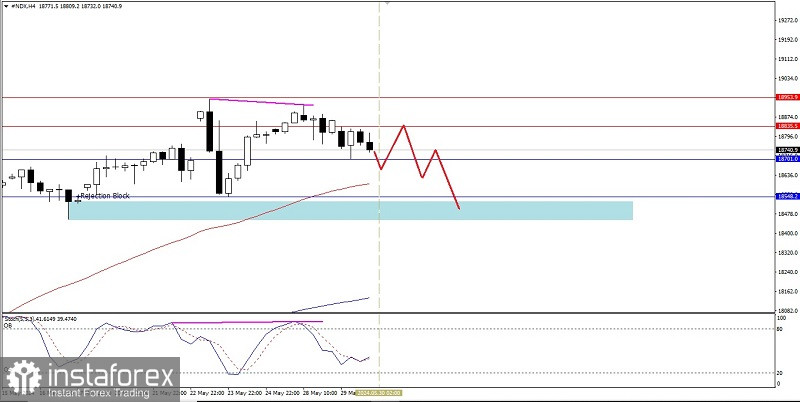
On the 4 hour chart of Nasdaq 100 Index, it is detected that there is a hidden deviation between its price movement with Stochastic Oscillator where this things gives the clue that in the near future #NDX has the potential to corrected downward from its Bullish bias which is currently taking place and in the near future #NDX is trying to break down below level 18701.0 where if this level is successfully penetrated below then level 18548.2 will be the next target to be aimed at and if the momentum and volatility are supportive then level 18457.4 will be the next target to be aimed at will be aimed at, but all of these weakening correction scenarios will automatically cancel if on the way #NDX suddenly turns back to its initial bias (Bull), especially if it succeeds in breaking above level 18953.9.
(Disclaimer)