 English
  Русский
 Bahasa Indonesia
 Bahasa Malay
 ไทย
ไทย Español
 Deutsch
 Български
 Français
 Tiếng Việt
 中文
中文 বাংলা
বাংলা हिन्दी
 Čeština
 Українська
 Română

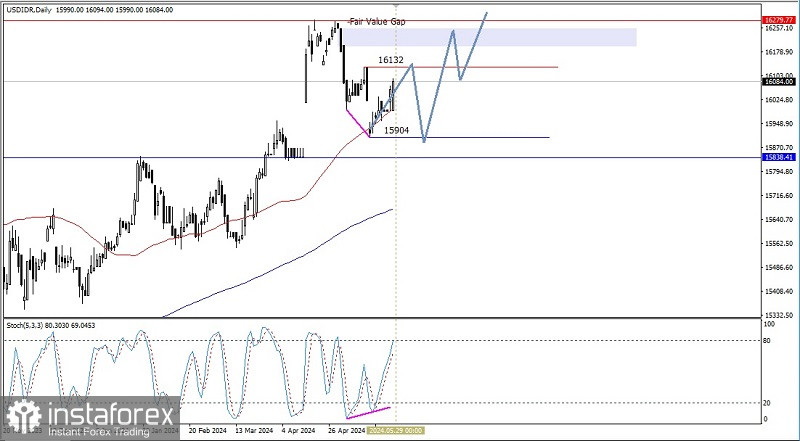
With the appearance of hidden deviations on the daily chart of the exotic currency pair of USD/IDR, in the next few days USD/IDR will try to test the 16132 level. If this level is successfully touched, USD/IDR has the potential to be corrected, weakening briefly to the level of 15904, but during the correction This weakening does not continue and does not breaks below the 15838 level, so USD/IDR still has the potential to continue strengthening up to the 16279.77 level because the strengthening and dominance of buyers has been confirmed by the condition of the Golden Cross intersection of the 50 MA which is above the 200 MA.
(Disclaimer)