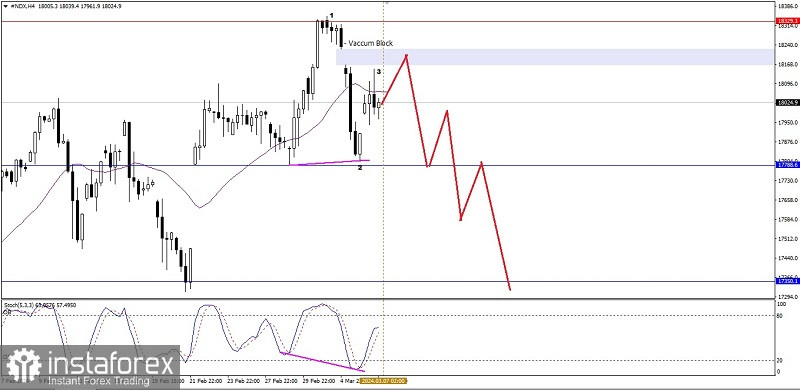
If we look on the 4 hour chart of Nasdaq 100 index, there is seems the price movement which moving below WMA 30 Shift 2 where this indicates the condition that are still dominating with the Seller, but with the appearance of the hidden deviation pattern between #NDX price movement with Stochastic Oscillator indicator, gives the clue that in the near future #NDX has the potential to corrected upward until the Bearish Vacuum Block level area around the level area of 18224.7-18164.9 but as long as the strengthening correction does not break above the level 18329,3, then #NDX still has the potential and has a chance to continue its weakness until the level of 17788.6. If this level successfully broken below, then the level 17350,1 will be the next target to be aimed of.
(Disclaimer)
 English
 Русский
 Bahasa Indonesia
 Bahasa Malay
 ไทย
ไทย Español
 Deutsch
 Български
 Français
 Tiếng Việt
 中文
中文 বাংলা
বাংলা हिन्दी
 Čeština
 Українська
 Română

