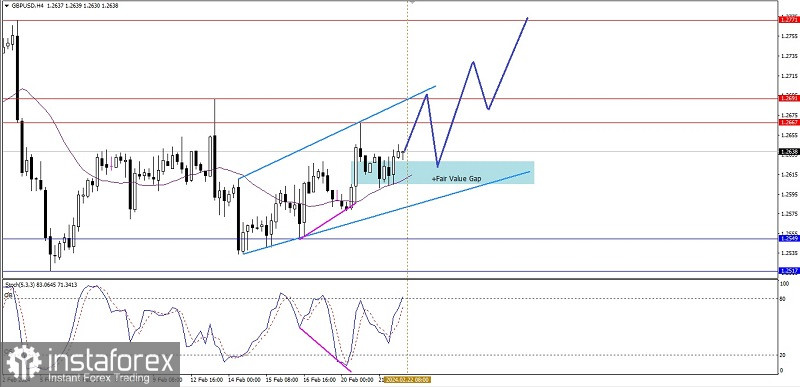
On the 4-hour chart, the main currency pair GBP/USD shows hidden deviations between its movements and the Stochastic Oscillator indicator, plus price movements are stuck at the level of the Bullish Fair Value Gap area and are above WMA 30 Shift 2 which has an upward slope, which all this gives an indication that in the near future the Cable has the potential to strengthen so that it will try to break above the 1.2267-1.2691 level area and if the momentum and volatility support it then the 1.2771 level will be the next target that will be tried to be tested but all of these strengthening scenarios will be canceled by themselves if there is a downward correction below level 1.2586 due to the appearance of the Ascending Broadening Wedge pattern.
(Disclaimer)
 English
 Русский
 Bahasa Indonesia
 Bahasa Malay
 ไทย
ไทย Español
 Deutsch
 Български
 Français
 Tiếng Việt
 中文
中文 বাংলা
বাংলা हिन्दी
 Čeština
 Українська
 Română

