 English
  Русский
 Bahasa Indonesia
 Bahasa Malay
 ไทย
ไทย Español
 Deutsch
 Български
 Français
 Tiếng Việt
 中文
中文 বাংলা
বাংলা हिन्दी
 Čeština
 Українська
 Română

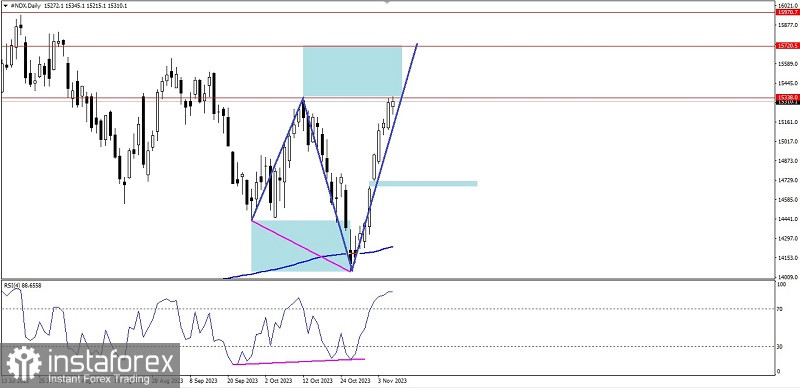
If we look on the daily chart of Nasdaq 100 index, then it can be seen that there is a deviation between the price movement with RSI indicator as well as the appearance of Bullish Y Wave Projection pattern, so that in a few days ahead, #NDX has the potential to appreciate up to the level of 15720,5. If the momentum and the volatility supports, then the level of 15970,7 will be the next target to be aimed of. But if on the way to those levels suddenly there is a weakness correction until it breaks below the level 14327,6, then the strengthening scenario that has been described before will become invalid and automatically cancel itself.
(Disclaimer)