 English
  Русский
 Bahasa Indonesia
 Bahasa Malay
 ไทย
ไทย Español
 Deutsch
 Български
 Français
 Tiếng Việt
 中文
中文 বাংলা
বাংলা हिन्दी
 Čeština
 Українська
 Română

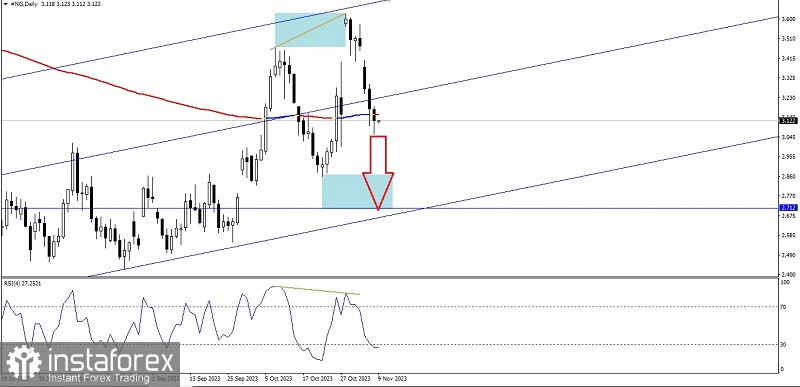
From the daily chart of Natural Gas Commodity asset, there is seems the deviation between its price movement with RSI indicator as well as the Bearish Y Wave Projection pattern, so that, in a few days ahead, Natural Gas has the potential to weaken and go down to the level 2,712. But if on the way to those levels suddenly there is an upward correction untuk it breaks above the level 3,407, then the downward scenario that has been described before will become invalid and will cancel itself.
(Disclaimer)