 English
  Русский
 Bahasa Indonesia
 Bahasa Malay
 ไทย
ไทย Español
 Deutsch
 Български
 Français
 Tiếng Việt
 中文
中文 বাংলা
বাংলা हिन्दी
 Čeština
 Українська
 Română

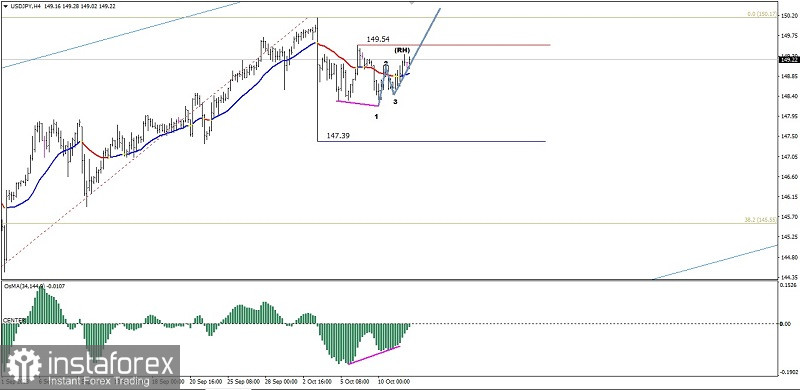
With deviations between price movements and the MACD Histogram indicator on the 4-hour chart of the main currency pair USD/JPY and followed by confirmation of the appearance of the Bullish 123 pattern which was followed by the appearance of the Bullish Ross Hook (RH) and price movements above the WMA (30) which has a slope with an upward slope, then in the near future USD/JPY has the potential to continue its rally towards the 149.54 level. If this level is successfully penetrated upwards, then the next level that will be aimed at is 150.17, however all of these strengthening scenarios will become invalid and cancel automatically. if suddenly there is a significant correction in USD/JPY until it breaks below level 148.18.
(Disclaimer)