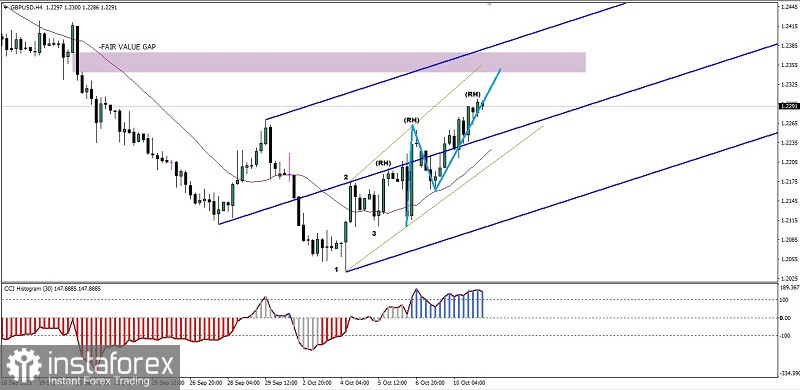
If we look on the 4 hour chart, GBP/USD main currency pairs seems moving inside the Bullish Pitchfork channel and above WMA (30 shift 2) which followed by CCI indicator, successfully break above its main three important levels and also followed by the appearance of Bullish 123 pattern as well as Bullish Ross Hook where all of this indicates the return of Buyers to the Cable so that as long as there is no downward correction which breaks below the level 1,2105, then, in the near future GBP/USD has the potential to rally above to enter the Bearish Fair Value Gap level area around 1,2344-1,2374.
(Disclaimer)
 English
 Русский
 Bahasa Indonesia
 Bahasa Malay
 ไทย
ไทย Español
 Deutsch
 Български
 Français
 Tiếng Việt
 中文
中文 বাংলা
বাংলা हिन्दी
 Čeština
 Українська
 Română

