Seller yang

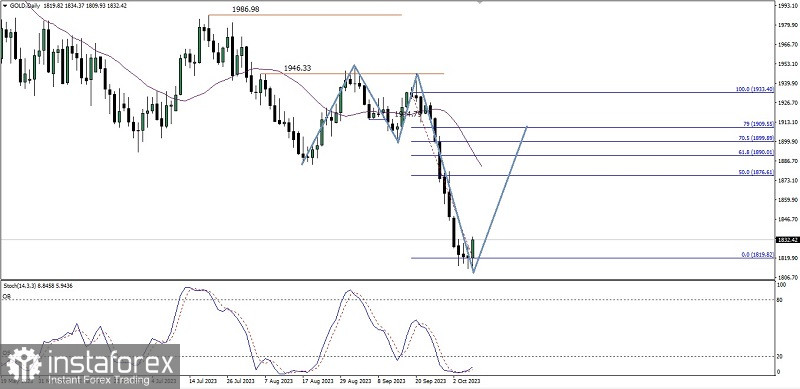
If we look at the daily chart of the Gold commodity asset, it can be seen that sellers are dominating this commodity asset, which is reflected in the price movement which moves below the Moving Average, but in the candles a few days before, a Bullish Engulfing candle pattern was formed, at the same time the Stochastic Oscillator indicator was in Oversold conditions so based on this, in the next few days Gold has the potential to rally upwards to the level of 1876.61 as the main target and 1890.01-1899.99 as the next target that will be achieved if the momentum and volatility support it during its journey towards these target levels. It happens that Gold continues its weakening again until it passes the 1809.93 level because if this level is successfully penetrated then all the strengthening correction scenarios that have been described previously will automatically cancel themselves.
(Disclaimer)
 English
 Русский
 Bahasa Indonesia
 Bahasa Malay
 ไทย
ไทย Español
 Deutsch
 Български
 Français
 Tiếng Việt
 中文
中文 বাংলা
বাংলা हिन्दी
 Čeština
 Українська
 Română

