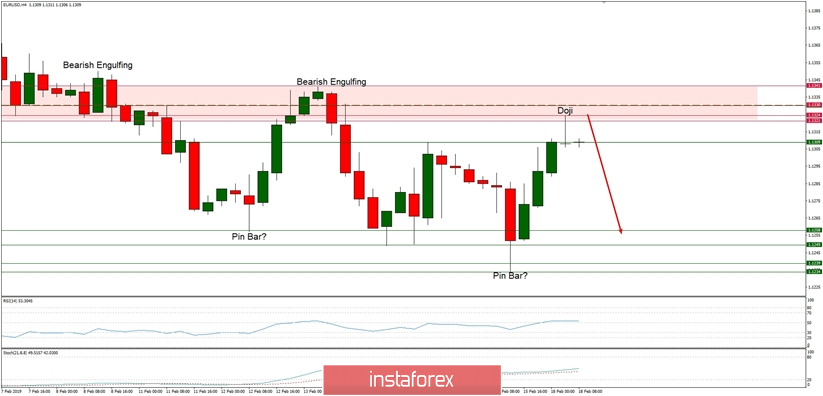
EUR/USD technical analysis for 18/02/2019:
The bounce was not very impressive, the price still under the resistnace
Technical market overview:
The EUR/USD market has bounced from the level of 1.1234 after the pin Bar candle was made and went straight up to the key technical resistance zone located between the levels of 1.1321 - 1.1341. The last candlestick looks like a Doji, so this would be a first indication of the possibility of the uptrend change to the downtrend. The nearest technical support is seen at the level of 1.1300, but it might be easily broken by bears. The momentum is still close to the neutral level, which is again not a very good indication of the strength of the bullish side of the market.
Weekly Pivot Points:
WR3 - 1.1452
WR2 - 1.1395
WR1 - 1.1341
Weekly Pivot - 1.1286
WS1 - 1.1238
WS2 - 1.1177
WS3 - 1.1130
Trading recommendations:
All of the buy orders that were bought during last week in the buyback zone are now closed with profit at the level of 1.1321. If you still have any open by orders, you should close them as close as possible to the level of 1.1321 and try to open a short-term sell trade with a tight protective stop-loss order. Target is seen at the level of 1.1300 and 1.1268.

 English
 Русский
 Bahasa Indonesia
 Bahasa Malay
 ไทย
ไทย Español
 Deutsch
 Български
 Français
 Tiếng Việt
 中文
中文 বাংলা
বাংলা हिन्दी
 Čeština
 Українська
 Română

