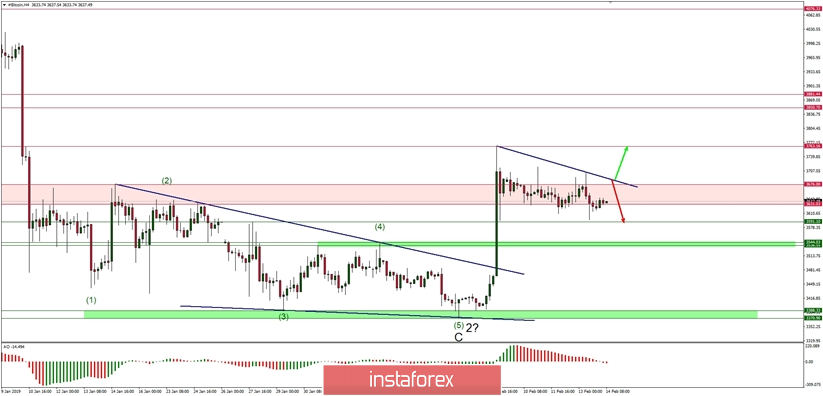
Bitcoin Elliott Wave analysis for 14/02/2019:
The consolidation continues, but not much bullish pressure so far.
Technical market overview:
The BTC/USD pair is still trading insdie of the horizontal consolidation zone, altought the triangle formation has been invalidated and the overall time of the consolidation is getting too long for the simple corrective pattern. It indicates that the correction will be evolving into more complex and time-cinsuming one. The support at the level of $3,591 was almost tested as the recent low was made only $4 higher at the level of $3,596. This level can still act as a valid support for the price, but the traders must be a little more patient. The next technical support, which is a key support zone, is seen between the levels of $3,536 - $3,544 and it can not be broken before the new high is made first.
Weekly Pivot Points:
WR3 - $4,242
WR2 - $4,002
WR1 - $3,885
Weekly Pivot - $3,610
WS1 - $3,455
WS2 - $3,290
WS3 - $3,068
Trading recommendations:
After the spike up the traders should try to buy the BTC at one of the buyback zones: $3,591 - $3,631 with a solid protective stop-loss order. The targets should be placed at the level of $3,767 or even above as the impulsive wave progression will unfold.

 English
 Русский
 Bahasa Indonesia
 Bahasa Malay
 ไทย
ไทย Español
 Deutsch
 Български
 Français
 Tiếng Việt
 中文
中文 বাংলা
বাংলা हिन्दी
 Čeština
 Українська
 Română

