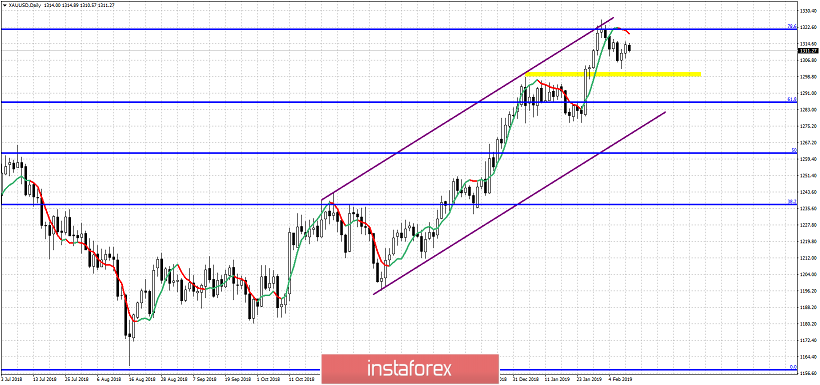
Gold price so far shows signs of weakness and signs that an important top is in at $1,326. Last time we warned for a pull back price fell from $1,326 to $1,302. There are still chances we see another test of $1,300 soon, specially as long as price is trading below $1,316.

Purple lines - bullish channel
Gold price remains in a bullish trend but with reversal signs as we warned after reaching our $1,320 target. Price could test the yellow rectangle area once again. Resistance is at $1,316 and support around $1,300. Breaking below it will push price towards the lower channel boundary support at $1,280-75 area. Breaking below this area will increase the chances that a major top is in. Holding above $1,280 keeps the bullish scenario of $1,350 alive.
 English
 Русский
 Bahasa Indonesia
 Bahasa Malay
 ไทย
ไทย Español
 Deutsch
 Български
 Français
 Tiếng Việt
 中文
中文 বাংলা
বাংলা हिन्दी
 Čeština
 Українська
 Română

