Technical market overview:
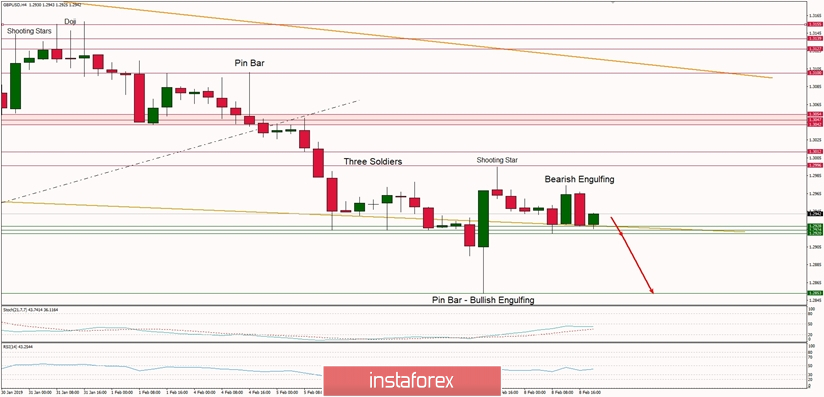
The GBP/USD pair is continuing the sideways movement after the rally towards the technical resistance has failed at the level of 1.2996 and the Shooting Star candlestick pattern was made. Since then the market has been going down towards the level of 1.2920 support as the bullish momentum decreased and is still weak and negative. More downside movement is expected if this level of 1.2920 is violated again and the first step towards the violation was made in a form of a local Bearish Engulfing candlestick pattern.
Weekly Pivot Points:
WR3 - 1.3314
WR2 - 1.3207
WR1 - 1.3066
Weekly Pivot - 1.2955
WS1 - 1.2817
WS2 - 1.2712
WS3 - 1.2570
Trading recommendations:
Due to the downtrend continuation, the traders should open only sell orders in the are between the levels of 1.2950 - 1.12996 with a target at the level of 1.2853 and below. Any violation of the level of 1.2920 let to open sell stop orders placed at from the level of 1.2919.

 English
 Русский
 Bahasa Indonesia
 Bahasa Malay
 ไทย
ไทย Español
 Deutsch
 Български
 Français
 Tiếng Việt
 中文
中文 বাংলা
বাংলা हिन्दी
 Čeština
 Українська
 Română

