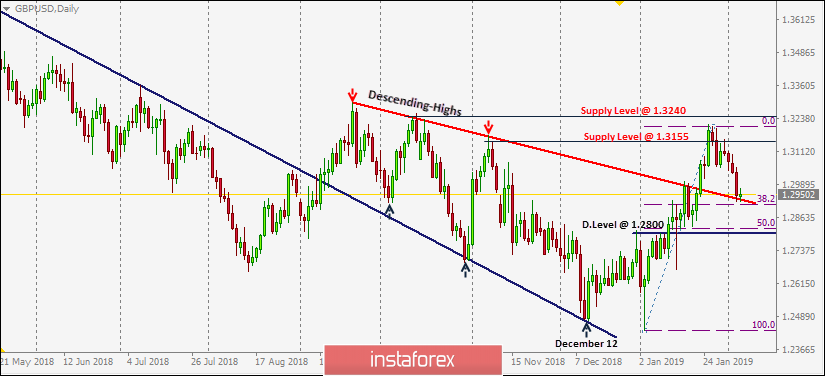
On December 12, the previously-dominating bearish momentum came to an end when the GBP/USD pair visited the price levels of 1.2500 where the backside of the broken daily uptrend was located.
Since then, the current bullish swing has been taking place until January 28 when the GBP/USD pair was almost approaching the supply level of 1.3240.
That's when the current bearish pullback was initiated around slightly lower price levels near 1.3215 (around the depicted supply levels in RED).
This was followed by a bearish engulfing daily candlestick on January 29. Thus, the GBP/USD pair lost its bullish persistence above 1.3155 as a result.
As expected, the recent bearish decline below 1.3150 brought the GBP/USD pair into a deeper bearish correction towards 1.3000 where lack of bullish demand was recently noticed.
That's why, further decline was demonstrated towards 1.2920-1.2950 where (38.2% Fibonacci level) as well as the backside of the depicted broken trend are located (in RED).
For the bullish scenario to remain valid, significant bullish recovery should be demonstrated around the current price levels 1.2920-1.2950. This would enhance a quick bullish visit towards 1.3000 and 1.3150.
Trade Recommendations:
Conservative traders should consider the current bearish pullback towards 1.2940-1.2920 (backside of the broken downtrend in RED) for a valid BUY entry.
T/P levels to be located around 1.3055, 1.3155 and 1.3200. Any bearish H4 closure below 1.2900 invalidates this scenario.
 English
 Русский
 Bahasa Indonesia
 Bahasa Malay
 ไทย
ไทย Español
 Deutsch
 Български
 Français
 Tiếng Việt
 中文
中文 বাংলা
বাংলা हिन्दी
 Čeština
 Українська
 Română

