English
  Русский
 Bahasa Indonesia
 Bahasa Malay
 ไทย
ไทย Español
 Deutsch
 Български
 Français
 Tiếng Việt
 中文
中文 বাংলা
বাংলা हिन्दी
 Čeština
 Українська
 Română

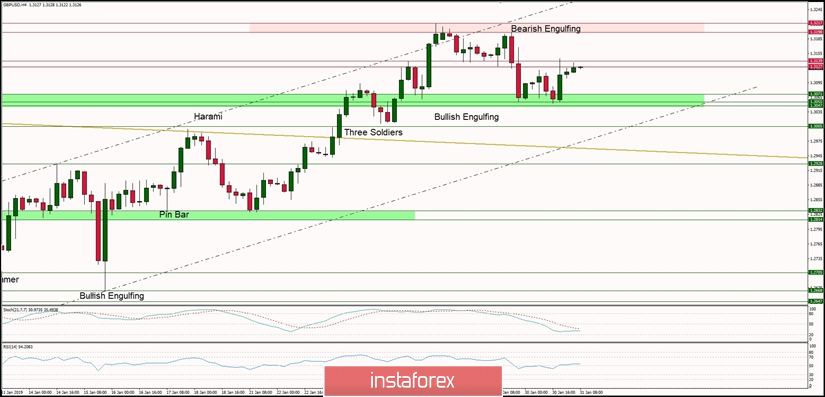
Technical analysis of GBP/USD for 31/01/2019:
The local support still hold its level for bulls to rally, swing top next?
Market technical overview:
The Bearish Engulfing candlestick pattern was enough to push the prices towards the level of 1.3055, but the bears did not break below this level. Moreover, during the next attempt to break it, the support was defended heavily and the price bounced towards the local resistance at the level of 1.3139 and is trading around this level right now. The market conditions look oversold and the momentum is weak but positive, so there is still a possibility of another rally higher towards the swing high at 1.3198 - 1.3217 zone. This scenario is possible as long as the price is trading inside of the channel (marked in dashed black). The technical resistance zone between the levels of 1.3047-1.3055 is the key technical support zone for bulls, so it is worth to keep an eye on this zone.
Trading recommendations:
The market is ready to bounce even higher towards the 1.3198 level, but first, the local technical resistance at 1.3139 must be clearly violated. All buy orders should have the protective stops placed below the level of 1.3047, this is the key level for bulls and it can not be violated.