 English
  Русский
 Bahasa Indonesia
 Bahasa Malay
 ไทย
ไทย Español
 Deutsch
 Български
 Français
 Tiếng Việt
 中文
中文 বাংলা
বাংলা हिन्दी
 Čeština
 Українська
 Română

Technical outlook:
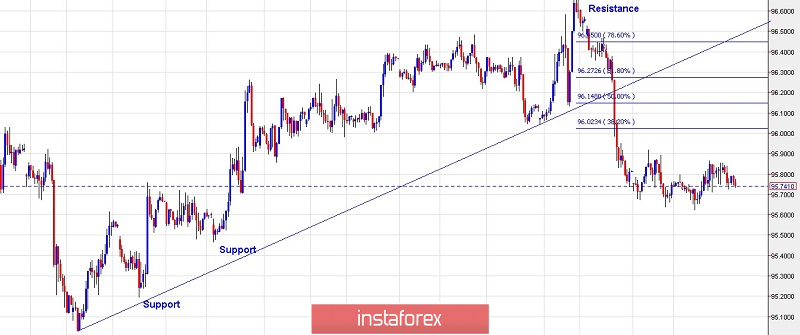
We have again presented the hourly chart for a short-term outlook on the US Dollar Index. As seen here, the US Dollar Index broke below the trend line support on Friday and also took out initial price support at 96.05 levels. The entire drop from 96.68 to 95.62 levels can now be considered as a primary boundary that could be retraced. Please note that a potential retracement levels could be fibonacci 0.618 resistance at 96.30, where a bearish reaction can be expected. Immediate price support is just below 95.50, while resistance is seen through 96.68 levels. A high probable direction from here could be on the north side as the counter trend unfolds, but please watch out for a bearish reaction around 96.30 levels. In the medium term, bears could regain control till prices stay below 96.68 levels.
Trading plan:
Aggressive setup could be to go long, stop below 95.50, target 96.30. Then lower on a bearish confirmation.
Good luck!