 English
  Русский
 Bahasa Indonesia
 Bahasa Malay
 ไทย
ไทย Español
 Deutsch
 Български
 Français
 Tiếng Việt
 中文
中文 বাংলা
বাংলা हिन्दी
 Čeština
 Українська
 Română

Gold price broke above $1,292 resistance we mentioned in our previous posts and this was a bullish signal. Gold price is now trading above $1,300 and could continue higher towards $1,315-20 which is our next target.
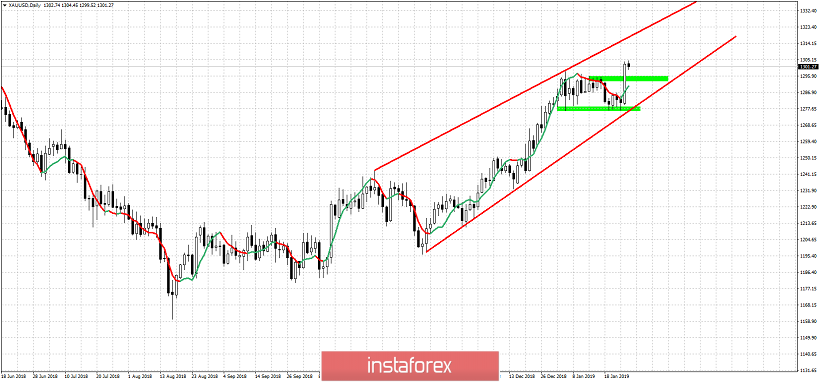
Red lines - bullish channel
Gold price remains in a bullish trend. We noted that only a break below $1,276 would open the way for a move towards $1,260. A break above $1,292 signaled that a bullish move was starting. Gold price remains in a bullish trend as long as price remains above $1.277. Short-term support is found at $1,292-95 and resistance at $1,315. Breaking below the lower red upward sloping trend line would be a bearish sign.