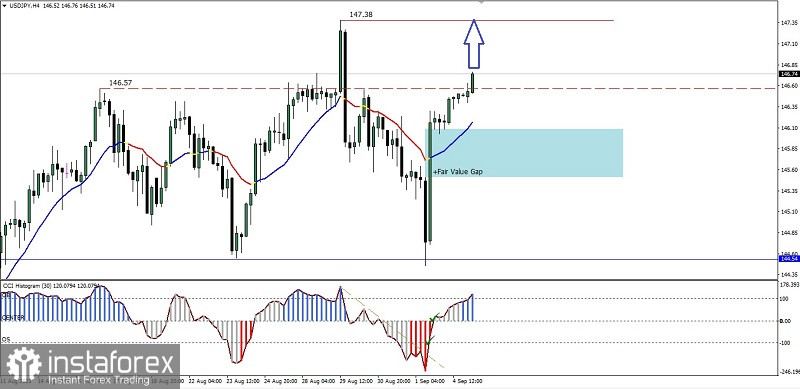
On its 4 hour chart of USD/JPY main currency pairs, there is CCI indicator which manages to break downside from its important three levels and break down the trendline (light brown ditted line) where currently the price is above WMA (20) so that based on this clue we can conclude that in the near future, USD/JPY will try to test the level 147,38, unless if on the way suddenly USD/JPY corrected downside back to break below the level 145,09, so all the rally scenario to the level of 147,38 will become invalid and will cancel itself.
(Disclaimer)
 English
 Русский
 Bahasa Indonesia
 Bahasa Malay
 ไทย
ไทย Español
 Deutsch
 Български
 Français
 Tiếng Việt
 中文
中文 বাংলা
বাংলা हिन्दी
 Čeština
 Українська
 Română

