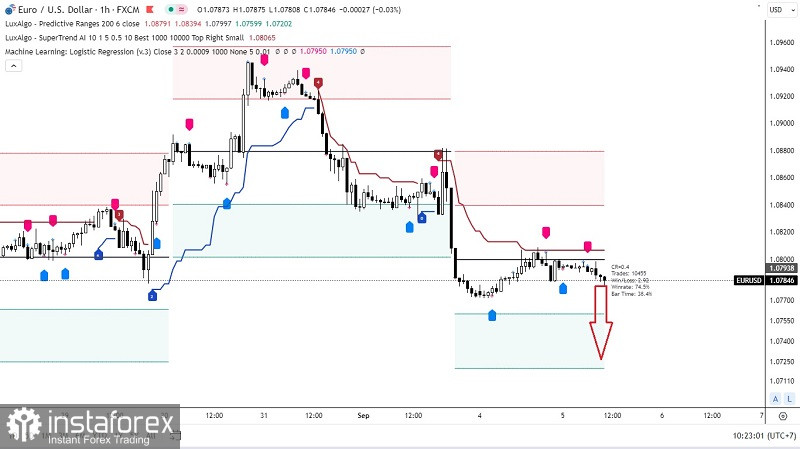
If we look at the 60 minute / 1 hour chart of the main EUR/USD currency pair, it can be seen that Fiber is in a ranging condition, which is indicated by the Predictive Range Average indicator (Dark Gray Line) which failed to make higher - highs, but even though it is in a ranging condition Sellers are still trying to dominate EUR/USD which can be seen from the Super Trend AI indicator which is still above price movement and is red and the last Logistic Regression indicator is giving a SELL signal (Pink) so based on these facts in the near future EUR/USD will try enter the level area 1.0670 - 1.0720 unless on the way to the level area there is a sudden upward correction which is quite significant enough to break above the 1.0807 level then the scenario previously described will become invalid and cancel automatically.
(Disclaimer)
 English
 Русский
 Bahasa Indonesia
 Bahasa Malay
 ไทย
ไทย Español
 Deutsch
 Български
 Français
 Tiếng Việt
 中文
中文 বাংলা
বাংলা हिन्दी
 Čeština
 Українська
 Română

