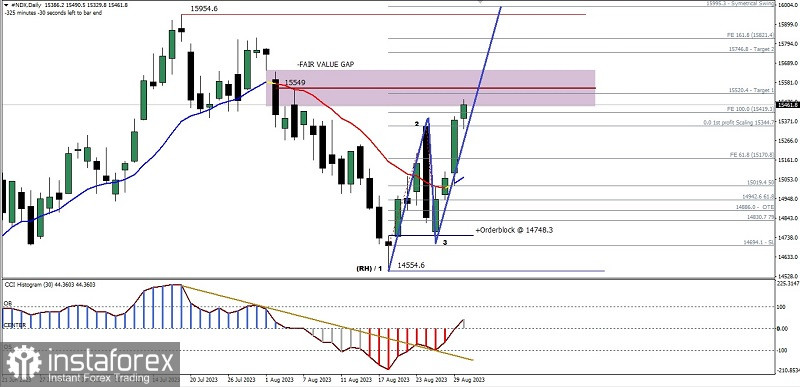
On its daily chart Nasdaq 100 index, there is the CCI indicator which breaks out above the falling trendline and is supported by price movements above the WMA (20) and the formation of a Bullish 123 pattern, so it is very likely that in the next few days #NDX will try to penetrate above level 15549. If this level is successfully broken, then #NDX has the potential to continue its rally up to level 15746.8-15821.4 as the initial target and level 15954.6 as the second target, but all of these scenarios will become invalid if on the way to these levels suddenly #NDX is corrected back down until it penetrates below level 14554.6.
(Disclaimer)
 English
 Русский
 Bahasa Indonesia
 Bahasa Malay
 ไทย
ไทย Español
 Deutsch
 Български
 Français
 Tiếng Việt
 中文
中文 বাংলা
বাংলা हिन्दी
 Čeština
 Українська
 Română

