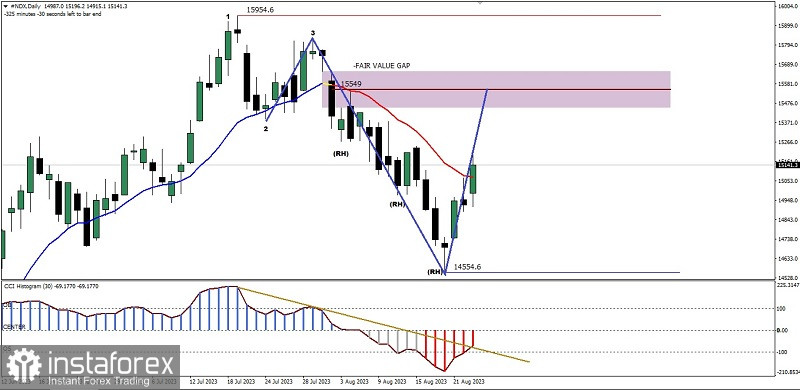
On its daily timeframe chart of Nasdaq 100 index, there is a price movement which succeed to broke above WMA (20) and Histogram CCI indicator managed to break above its trendline where this indicating the middle of an upward correction to test the 15549 level which also coincided with the start of the Mercury Retrograde astrological phenomenon so that in the next few days it is possible that #NDX will experience a bullish rally provided there is no weakening that breaks below the 14554.6 level because if this level is successfully broken down before reaching the level of 15549 then #NDX will be brought back to its Bearish bias.
(Disclaimer)
 English
 Русский
 Bahasa Indonesia
 Bahasa Malay
 ไทย
ไทย Español
 Deutsch
 Български
 Français
 Tiếng Việt
 中文
中文 বাংলা
বাংলা हिन्दी
 Čeština
 Українська
 Română

