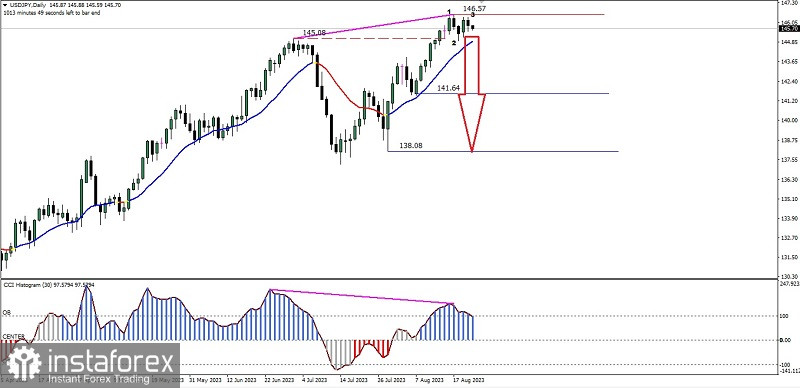
On the daily chart of the main USD/JPY currency pair, a deviation pattern can be seen between the price movement and the CCI Histogram indicator which coincidentally today coincides with the Mercury Retrograde phenomenon which generally provides Time Resistance for the currency pair so that in the next few days USD /JPY has the potential to go down to the turning point at the level of 144.94. If this level is successfully broken below then USD/JPY has the opportunity to continue weakening up to the level 141.64 as the main target and the level 138.08 as the second target but with a note that during the journey down there was no upward correction and above that exceeds the level of 146.57.
(Disclaimer)
 English
 Русский
 Bahasa Indonesia
 Bahasa Malay
 ไทย
ไทย Español
 Deutsch
 Български
 Français
 Tiếng Việt
 中文
中文 বাংলা
বাংলা हिन्दी
 Čeština
 Українська
 Română

