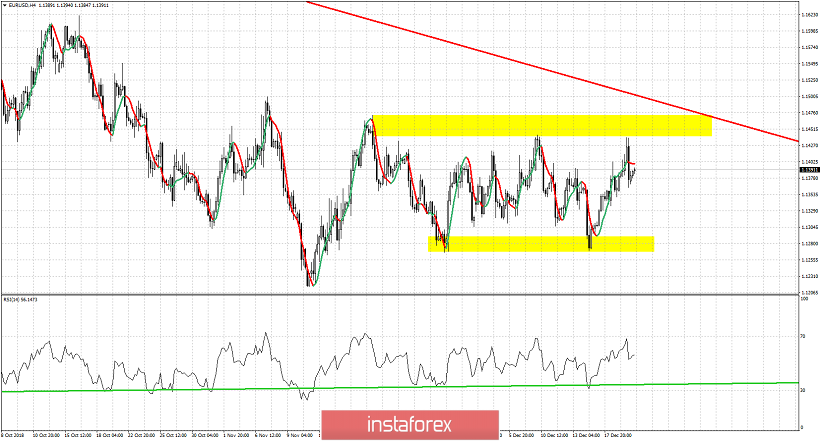
EUR/USD made another try yesterday to break above the 1.14-1.1430 resistance area but if failed once again. Price remains inside the range of 1.13-1.14 since November. The triangle scenario has been canceled as both the downward break and yesterday's upward break were fake ones.

Yellow rectangles - range boundaries
Red line - major trend line resistance
EUR/USD reached 1.1440 yesterday but got rejected at the upper range boundary. So far we have seen three tops in this area and all of them resulting in a pull back towards 1.13 or lower. So far around 1.1270-1.13 we have seen two lows and two bounces. There will not be a fourth rejection at 1.1430. Next time we see move towards that level I expect it to be broken. If we do not move towards 1.1430, it is important to be patient and see how market reacts again at the lower boundary support at the 1.1270-1.13 area.
 English
 Русский
 Bahasa Indonesia
 Bahasa Malay
 ไทย
ไทย Español
 Deutsch
 Български
 Français
 Tiếng Việt
 中文
中文 বাংলা
বাংলা हिन्दी
 Čeština
 Українська
 Română

