Overview:
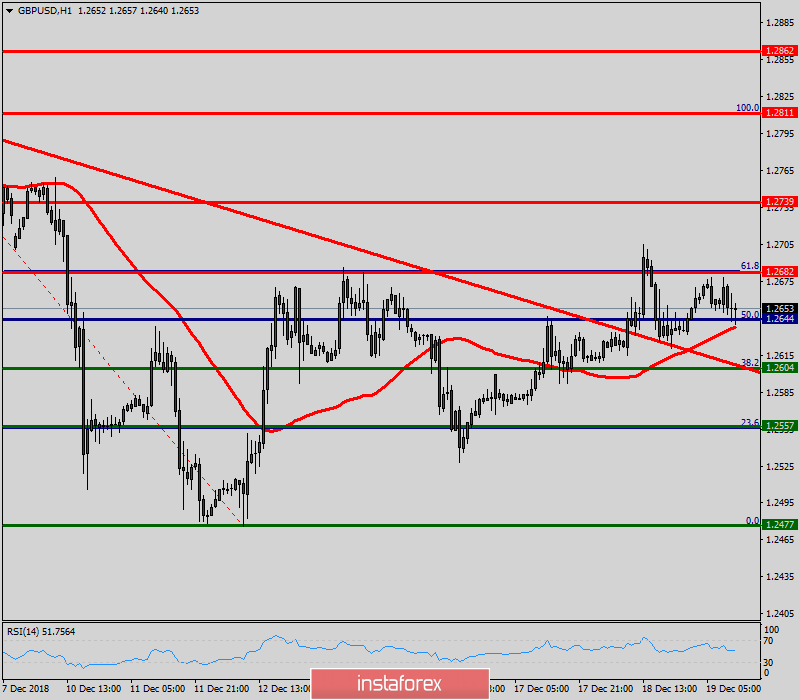
The GBP/USD pair broke resistance at 1.2604 which turned into strong support yesterday. This level coincides with 38.2% of Fibonacci retracement which is expected to act as major support today. Equally important, the RSI is still signaling that the trend is upward, while the moving average (100) is headed to the upside. Accordingly, the bullish outlook remains the same as long as the EMA 100 is pointing to the uptrend. This suggests that the pair will probably go above the daily pivot point (1.2644) in the coming hours. The GBP/USD pair will demonstrate strength following a breakout of the high at 1.2682. Consequently, the market is likely to show signs of a bullish trend. In other words, buy orders are recommended above 1.2644 with the first target at 1.2682. Then, the pair is likely to begin an ascending movement to 1.2682 mark and further to 1.2739 levels. The level of 1.2739 will act as strong resistance, and the double top is already set at 1.2811. On the other hand, the daily strong support is seen at 1.2604. If the GBP/USD pair is able to break out the level of 1.2604, the market will decline further to 1.2557 (daily support 2).
 English
 Русский
 Bahasa Indonesia
 Bahasa Malay
 ไทย
ไทย Español
 Deutsch
 Български
 Français
 Tiếng Việt
 中文
中文 বাংলা
বাংলা हिन्दी
 Čeština
 Українська
 Română

