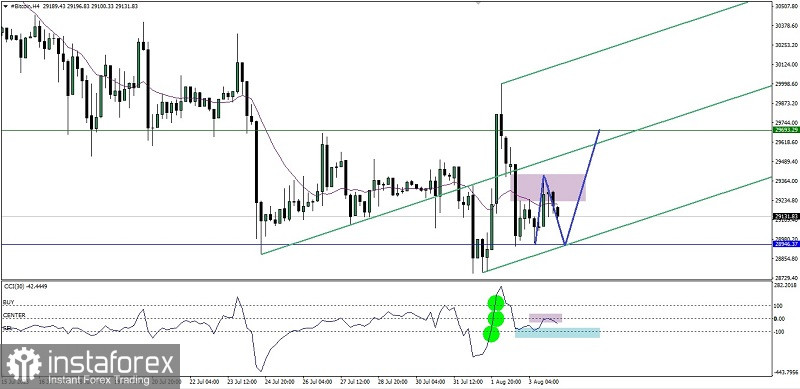
On the 4-hour chart, the Bitcoin Cryptocurrency appears to be moving in a Ranging / Sideways state where this is indicated by the Moving Average moving between Candle bodies but with the three main levels being penetrated on the CCI indicator which is then halted in its movement in the -100 to 0 level range giving a hint that Bitcoin has found a significant resistance level in this case the Bearish Fair Value Gap level so that in the near future it will try to test the support level at 28946.37 and as long as the decline does not exceed the 28760.23 level then Bitcoin has the opportunity to strengthen up again up to the 29693.29 level because after all also Bitcoin is moving harmoniously inside the Bullish Pitchfork channel.
(Disclaimer)
 English
 Русский
 Bahasa Indonesia
 Bahasa Malay
 ไทย
ไทย Español
 Deutsch
 Български
 Français
 Tiếng Việt
 中文
中文 বাংলা
বাংলা हिन्दी
 Čeština
 Українська
 Română

