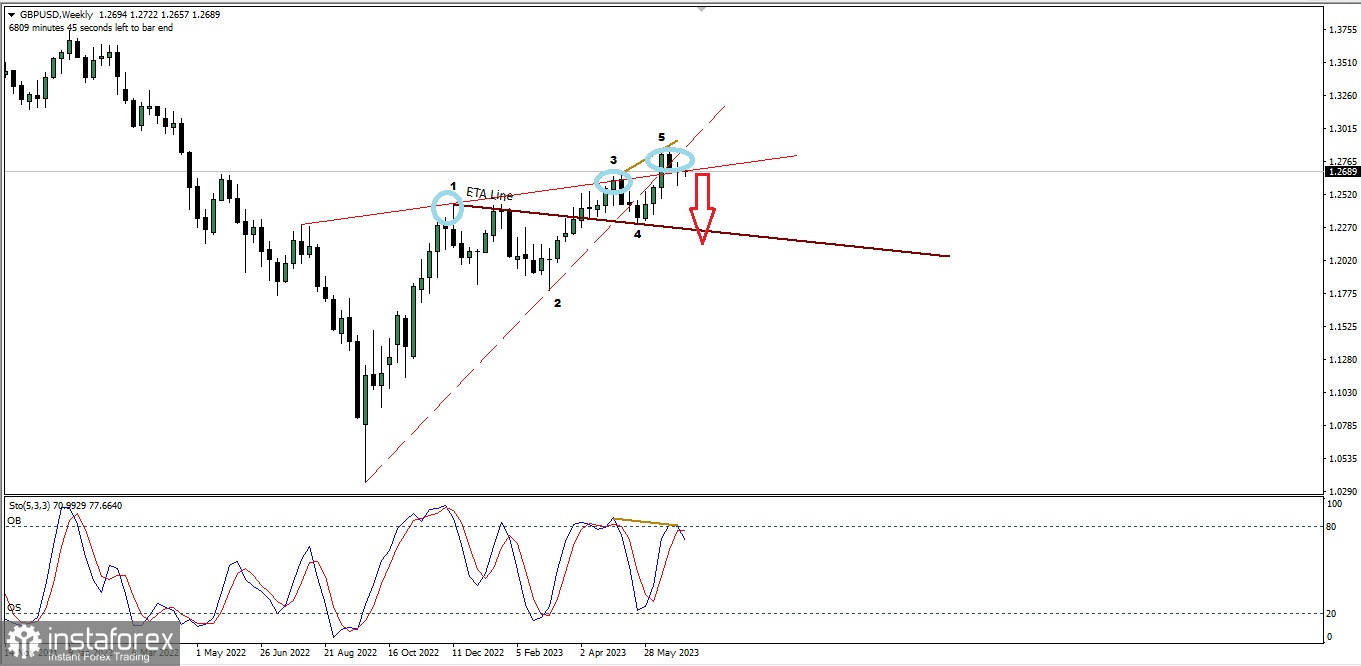
Based on what we can see on its GBP/USD weekly chart, there is a few interesting things:
1. The appearance of Bearish Divergent between Stochastic with GBP/USD.
2. The appearance of Bearish Three Little Indian (Cyan circle).
3. The appearance of Rising Wedge weakening Pattern.
4. There is a Wolve Waves Pattern.
Based on those facts above, Cable seems has the chance to continue its quite huge downward tren, maximum in the next 2 weeks where as long as there is no upward correction rally that exceeds the 1.2850 level, GBP/USD will try to fall down towards the trend line ETA Line of its Wolve Wave or at least to the 1.2307 level as its main target.
(Disclaimer)
 English
 Русский
 Bahasa Indonesia
 Bahasa Malay
 ไทย
ไทย Español
 Deutsch
 Български
 Français
 Tiếng Việt
 中文
中文 বাংলা
বাংলা हिन्दी
 Čeština
 Українська
 Română

