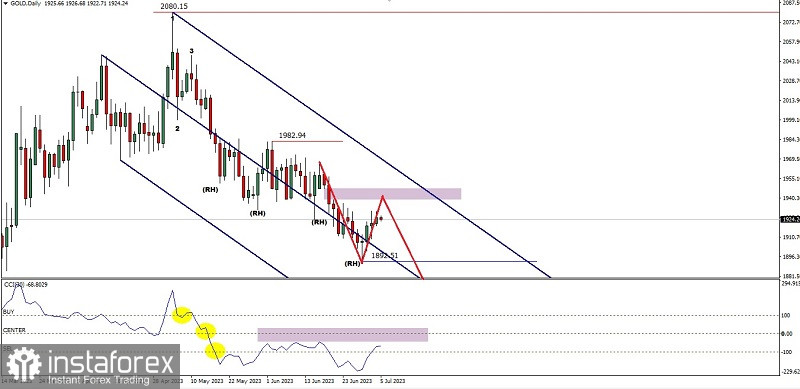
From what we see in the daily chart of Gold commodity asset, Gold seems moving inside bearish Pitchfork channel as well as confirmed by CCI indicator which manages to break down to the level 100, 0, & -100 and currently stuck moving at the -100 to 0 area level, all of which indicate the trend condition of Gold on the daily chart is still in a bearish condition except when a correction rally occurs above the 1956.28 level and is supported by the CCi indicator which managed to break above level 0 and above level 100 then it is possible that the bearish condition will be restrained for the next few days but if this does not happen then the probability to continue the decline is quite large where the Ross Hook level 1892.51 will be the main target for gold in the next few days.
(Disclaimer)
 English
 Русский
 Bahasa Indonesia
 Bahasa Malay
 ไทย
ไทย Español
 Deutsch
 Български
 Français
 Tiếng Việt
 中文
中文 বাংলা
বাংলা हिन्दी
 Čeština
 Українська
 Română

