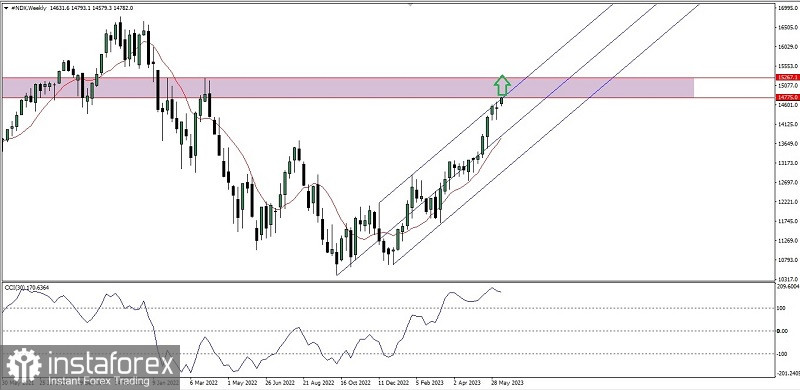
From the weekly chart of the Nasdaq 100 index it can be seen that Buyers are still holding quite strong control which can be seen from the #NDX movement which moves harmoniously within the bullish Pitchfork channel and above the 10 Week Average price movement and the CCI indicator which moves above the 100 level so that based these facts in the near future #NDX will try to reach the level of 15267.1 but even if there is a momentary downward correction of course it will only be limited to testing the midline level of the Bullish Pitchfork Channel and not exceeding below the 13531.2 level because if this level is successfully broken down then there is a high probability of a Bullish Trend what is going on will be disrupted.
(Disclaimer)
 English
 Русский
 Bahasa Indonesia
 Bahasa Malay
 ไทย
ไทย Español
 Deutsch
 Български
 Français
 Tiếng Việt
 中文
中文 বাংলা
বাংলা हिन्दी
 Čeština
 Українська
 Română

