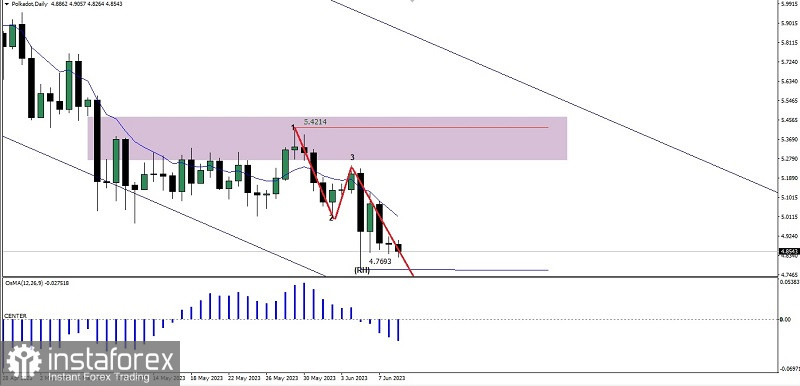
On the daily chart, the Polkadot Cryptocurrency, after being stuck in the Bearish Fair Value Gap area of 5.4755-5.2768 and supported by the osMA indicator in the negative area and the appearance of the Bearish 123 pattern followed by Ross Hook (RH), has the potential to go down in the next few days up to the level of 4.7693 unless on the way to the target there is a sudden correction rally going up past the level of 5.6662, then most likely the Bear movement described earlier will become invalid and cancel automatically.
(Disclaimer)
 English
 Русский
 Bahasa Indonesia
 Bahasa Malay
 ไทย
ไทย Español
 Deutsch
 Български
 Français
 Tiếng Việt
 中文
中文 বাংলা
বাংলা हिन्दी
 Čeština
 Українська
 Română

