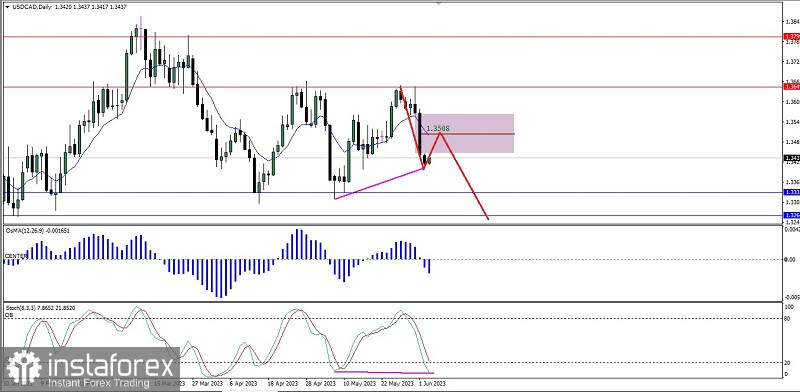
Even though The Lonnie's condition on the daily chart looks to be in a Ranging Sideways condition and is moving downwards on the daily chart, however by the appearance of hidden deviations between the osMA indicator and the USD/CAD pair's price movements gives a hint that in the next few days USD/CAD has the potential to rise above to test the 1.3508 level and as long as the upward correction does not exceed the 1.3584 level, USD/CAD will fall back down to test the 1.3333 and 1.3264 levels.
(Disclaimer)
 English
 Русский
 Bahasa Indonesia
 Bahasa Malay
 ไทย
ไทย Español
 Deutsch
 Български
 Français
 Tiếng Việt
 中文
中文 বাংলা
বাংলা हिन्दी
 Čeština
 Українська
 Română

