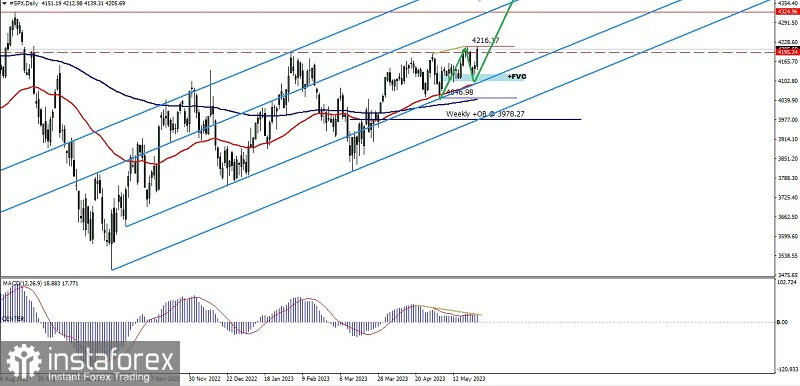
With the price movement in the channel that dips upwards and the two Moving Averages which are still in Golden Cross condition on the daily chart, we can see that Buyers are still dominating the S&P 500 index so that in the next few days #SPX has the potential to appreciate an upward rally up to penetrate above the level of 4216.17 and if this level is successfully broken above then the SPX still has the potential to go to the upper line of the bullish channel and/or the level of 4324.96 but please also pay attention if there is a downward correction which is indicated by the appearance of deviations between price movements and the MACD indicator because if a correction occurs If it breaks below the level of 4070.35 then all scenarios of a rally up above that have been described previously will become invalid.
(Disclaimer)
 English
 Русский
 Bahasa Indonesia
 Bahasa Malay
 ไทย
ไทย Español
 Deutsch
 Български
 Français
 Tiếng Việt
 中文
中文 বাংলা
বাংলা हिन्दी
 Čeština
 Українська
 Română

