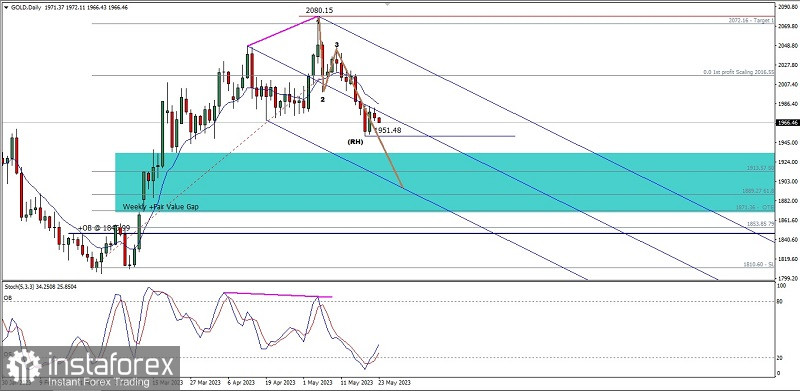
On the daily chart of gold commodity asset It can be seen that this commodity asset is being pressured down where sellers are currently more dominant. The several things that confirm the weakening of this commodity asset are:
1. Price movement which moves inside Pitchfork channel that dives down.
2. Price movement which moves below its EMA 10.
3. The appearance of Bearish 123 follow by Bearish Ross Hook.
4. The presence of deviations between price movements and the Stochastic Oscillator indicator.
Based on these four things, within the next few days Gold commodity assets have the potential to depreciate to the level of 1951.48 and if this level is successfully broken below it, Gold has the potential to continue its decline to the level of 1913.57 or the Lower Line of the bearish Pitchfork channel but unfortunately all downside scenarios it can become invalid and cancel by itself if there is a sudden upward correction movement which exceeds the level of 2016.55.
(Disclaimer)
 English
 Русский
 Bahasa Indonesia
 Bahasa Malay
 ไทย
ไทย Español
 Deutsch
 Български
 Français
 Tiếng Việt
 中文
中文 বাংলা
বাংলা हिन्दी
 Čeština
 Українська
 Română

