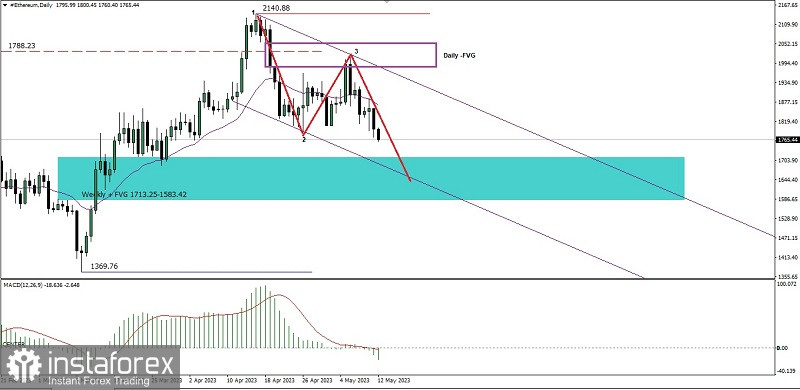
After the Ethereum Cryptocurrency managed to break above the 1788.23 level on the daily chart, Ethereum is now being pulled down below that level again where the current bias of #ETH is Bearish which is confirmed by price movements moving in a channel that dips downwards and price movements that is below the Moving Average and the MACD indicator is in Positive SELL condition and a Bearish 123 pattern appears, so in the near future #ETH has the potential to fall down to the 1713.25-1583.42 area level as the main target and the 1543.52 level as the second target but this decline scenario may fail automatically if on the way to these levels suddenly #ETH turns corrected up above the 1923.57 level because if this level is broken then the decline that is currently happening in this Crypto currency will be halted for a moment for the next few days.
(Disclaimer)
 English
 Русский
 Bahasa Indonesia
 Bahasa Malay
 ไทย
ไทย Español
 Deutsch
 Български
 Français
 Tiếng Việt
 中文
中文 বাংলা
বাংলা हिन्दी
 Čeština
 Українська
 Română

