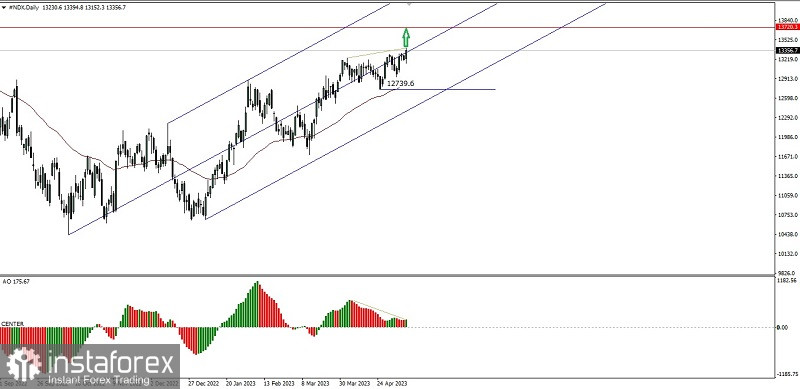
On the daily chart, Nasdaq 100 index seems moving inside the Bullish Pitchfork channel harmoniosly where #NDX currently struggle to continue its rally by trying to test the level of 13720,3. However, with the appearance of deviation between #NDX price movement with Awesome Oscillator indicator gave the clue if there is a potential of downward correction in #NDX. But, as long as the downward correction does not go below the level of 12739.6 then #NDX still has a chance to continue strengthening.
(Disclaimer)
 English
 Русский
 Bahasa Indonesia
 Bahasa Malay
 ไทย
ไทย Español
 Deutsch
 Български
 Français
 Tiếng Việt
 中文
中文 বাংলা
বাংলা हिन्दी
 Čeština
 Українська
 Română

