 English
  Русский
 Bahasa Indonesia
 Bahasa Malay
 ไทย
ไทย Español
 Deutsch
 Български
 Français
 Tiếng Việt
 中文
中文 বাংলা
বাংলা हिन्दी
 Čeština
 Українська
 Română

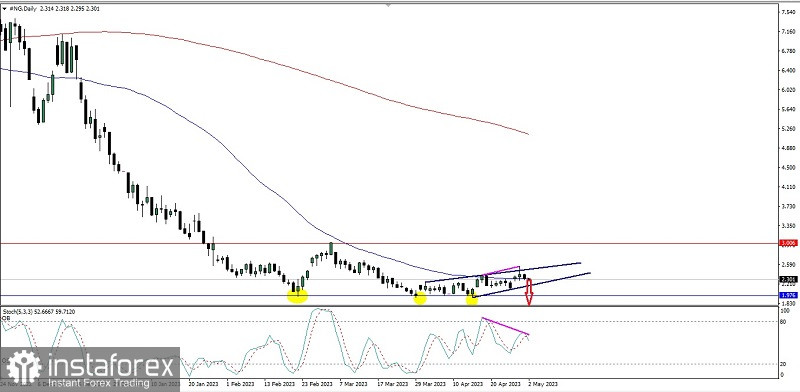
On the daily chart of Natural Gas commodity asset, there are quite a few interesting facts:
1. The Moving Average is in a condition where it crosses Death Cross, which means it is Bearish bias.
2. The appearance of the Bearish Continuation Rising Wedge pattern appears.
3. There are deviations between price movements and the Stochastic Oscillator indicator,
4. There is an Equal Low level (triple Top yellow circle).
Then, based on the four facts above, Natural Gas in the next few days has the opportunity to continue its decline to the level of 1,976 but if something happens that makes a significant upward correction so that this commodity asset breaks above the 2,551 level then the scenario of the decline described earlier most likely will be held for the next few days.
(Disclaimer)