 English
  Русский
 Bahasa Indonesia
 Bahasa Malay
 ไทย
ไทย Español
 Deutsch
 Български
 Français
 Tiếng Việt
 中文
中文 বাংলা
বাংলা हिन्दी
 Čeština
 Українська
 Română

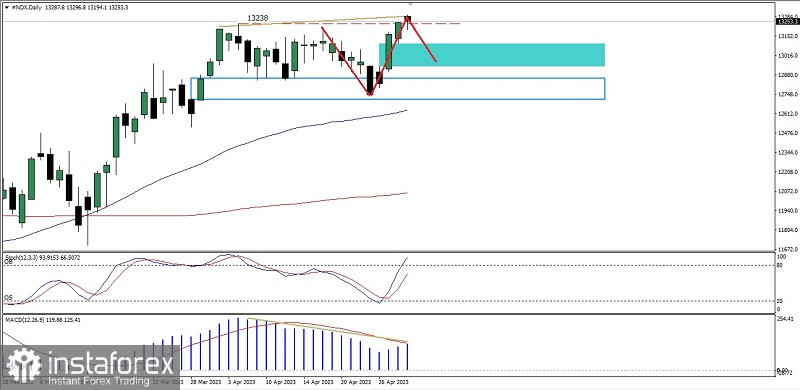
If we look at the daily chart, the Nasdaq 100 index seems to be still moving in a bullish bias condition which is marked by price movements above the 50 and 200 Moving Averages where the two Moving Averages are still in the Golden Cross condition but after successfully breaking above the Old High 13238 there is probability #NDX will experience a downward correction to regain its momentum where this is confirmed by the condition of the Stochastic Oscillator which is already in the overbought territory and the emergence of irregularities between the #NDX price movement and the MACD indicator where the level of the Bullish Fair Value Gap area 13099.8-12938.0 will become the attraction for #NDX to be tested and as long as the downward correction does not exceed below the 12900 level, the bullish bias still prevails on the Nasdaq 100 index.
(Disclaimer)