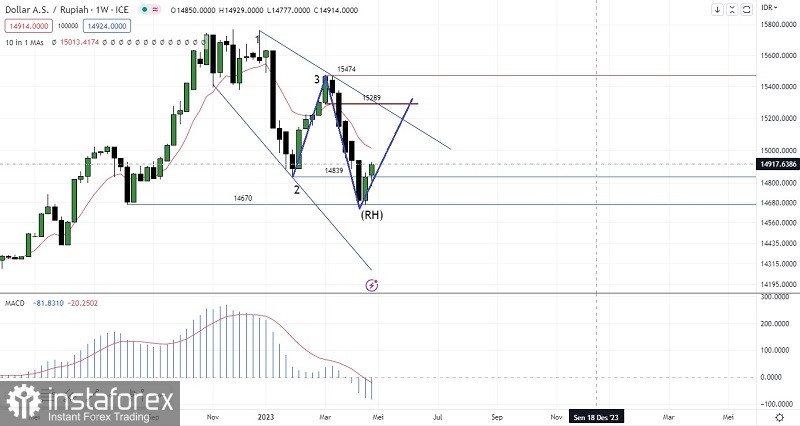
Even though the MACD indicator on the weekly chart for the exotic USD/IDR currency pair looks to be in the Positive SELL area and is supported by the presence of the Bearish 123 pattern followed by the appearance of Ross Hook as if confirming that the Rupiah is in a strengthening condition but after successfully testing the 14670 level now It seems that the Rupiah must be corrected to weaken first to the level of 15289 where this is confirmed by the emergence of the Descending Broadening Wedge pattern and as long as the correction to the weakening of the Garuda currency does not exceed the level of 15474 then the strengthening of the Rupiah is confirmed and has the potential to strengthen again to the level of 14649.
(Disclaimer)
 English
 Русский
 Bahasa Indonesia
 Bahasa Malay
 ไทย
ไทย Español
 Deutsch
 Български
 Français
 Tiếng Việt
 中文
中文 বাংলা
বাংলা हिन्दी
 Čeština
 Українська
 Română

