 English
  Русский
 Bahasa Indonesia
 Bahasa Malay
 ไทย
ไทย Español
 Deutsch
 Български
 Français
 Tiếng Việt
 中文
中文 বাংলা
বাংলা हिन्दी
 Čeština
 Українська
 Română

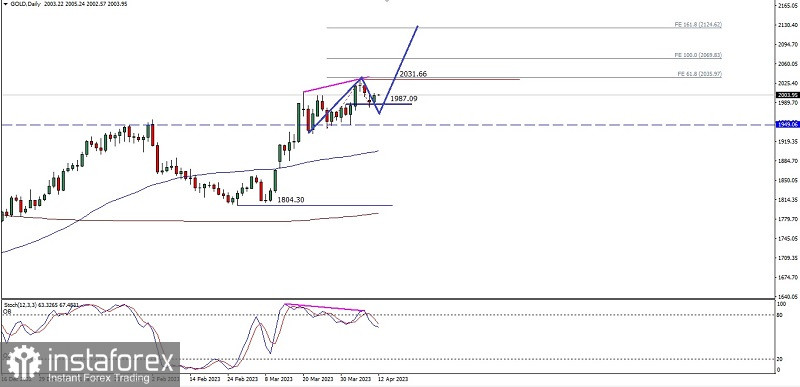
If we look on its daily chart of Gold Commodity assets, it appears that there is a deviation between price movements and the Stochastic Oscillator indicator so that in the next few days Gold has the potential to fall down to test its Bullish Orderblock level at 1987.09 if this level is strong enough to hold the rate of weakening of this commodity asset means that gold still has the potential to appreciate upwards to the level of 2031.66 as the main target and the level of 2124.62 as the second target but if the level of 1987.09 is not strong enough to hold the rate of correction of the weakening to pass below the level of 1917.77 then all the scenarios previously described will become invalid and cancel by itself.
(Disclaimer)