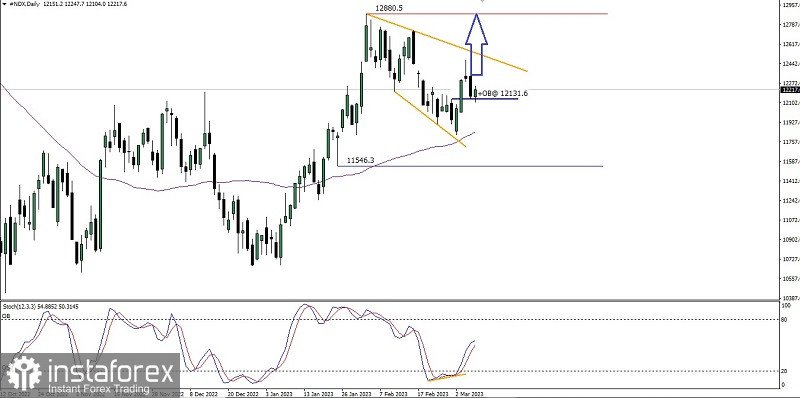
If we look at the daily chart of Nasdaq 100 Index then there will be a few interesting things:
1. The appearance of deviation between price movement with Stochastic Oscillator indicator.
2. Price movement which still moves above its MA 50.
3. The appearance of Bullish Continuation Descending Broadening Wedge pattern.
Based on those facts in a few days ahead, #NDX has the potential to appraciated upward up to the level 12880,5 particularly if the Bullish Orderblock level 12131,6 able to be a strong support level however if not, then please look at the level 11821,3 because if this level successfully broken downward then all the Bulls scenario that has been described before will become invalid and cancel by itself.
(Disclaimer)
 English
 Русский
 Bahasa Indonesia
 Bahasa Malay
 ไทย
ไทย Español
 Deutsch
 Български
 Français
 Tiếng Việt
 中文
中文 বাংলা
বাংলা हिन्दी
 Čeština
 Українська
 Română

