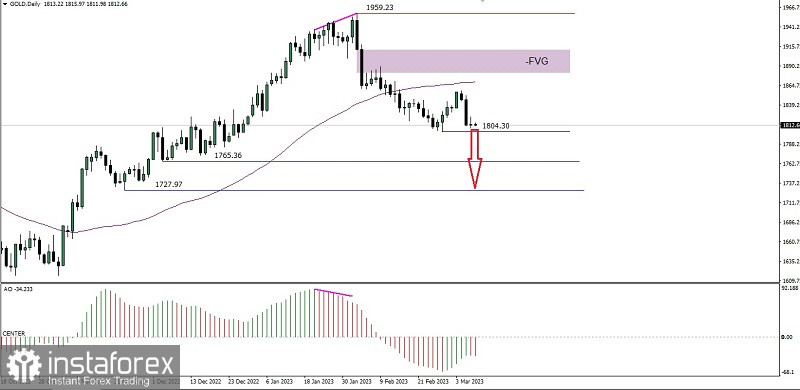
On the daily chart of gold commodity asset, there are two interesting things:
1. Price movement which moves below MA 50.
2. The appearance of deviation between price movement with Awesome Oscillator indicator.
Based on those two things confirmed that on the few days ahead the gold commodity asset will try to go down to break under the level 1804,30 if this level successfully broken below, then gold has the potential to go downward to the level of 1765,36 as the first target and level 1727,97 as the second target as long as on the way down there is no upward correction which exceeds the level of 1918.13 because if this level is successfully penetrated then it is certain that all the downward scenarios described earlier will become invalid and cancel automatically.
(Disclaimer)
 English
 Русский
 Bahasa Indonesia
 Bahasa Malay
 ไทย
ไทย Español
 Deutsch
 Български
 Français
 Tiếng Việt
 中文
中文 বাংলা
বাংলা हिन्दी
 Čeština
 Українська
 Română

