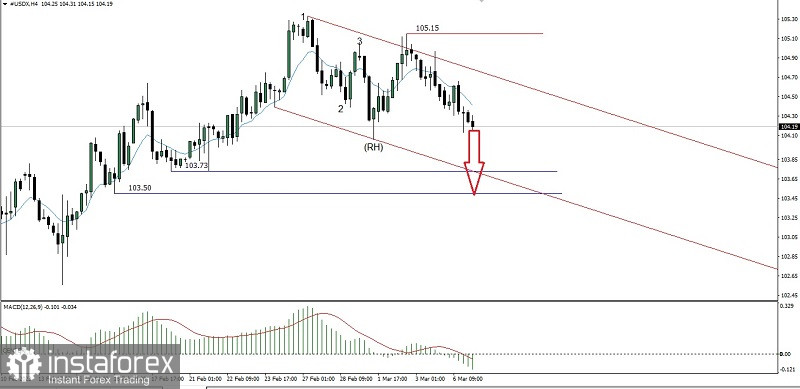
There is a few interesting things on the USDX 4 hour chart :
1. Bearish 123 pattern followed by the appearance of Ross Hook (RH).
2. Move inside the downside channel.
3. Move under the EMA 10.
From those three things abobe seems like #USDX will continue the downside until if it manages to break below level 104,06. If this level successfully broken then #USDX has the potential to go downside up to the level 103,73 as the main target and the level 103,50 as the next target to be addressed as long as there is no upward correction passing through the level 104,97 because if this level successfully broken above then all the downward scenario that has been described before will cancel itself.
(Disclaimer)
 English
 Русский
 Bahasa Indonesia
 Bahasa Malay
 ไทย
ไทย Español
 Deutsch
 Български
 Français
 Tiếng Việt
 中文
中文 বাংলা
বাংলা हिन्दी
 Čeština
 Українська
 Română

