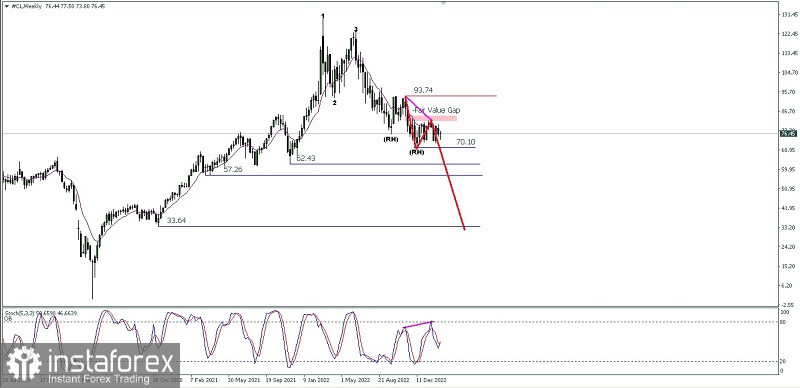
On the weekly chart, the Crude Oil commodity asset shows hidden deviations between its price movements and the Stochastic Oscillator indicator so that in the near future #CL has the potential to go down where in the near future it will try to test the Ross Hook (RH) level at 70.10 if this level succeeds penetrated below, the 62.43 - 57.26 area will be the main target to aim for and if the momentum and volatility are sufficiently supportive then it is possible that the 33.64 level will be the next target to aim for provided that during the way down to these targets there is no upward correction movement significant upwards to pass the 93.74 level because if this level is broken then all the downside scenarios that have been previously described will become invalid and cancel automatically.
(Disclaimer)
 English
 Русский
 Bahasa Indonesia
 Bahasa Malay
 ไทย
ไทย Español
 Deutsch
 Български
 Français
 Tiếng Việt
 中文
中文 বাংলা
বাংলা हिन्दी
 Čeština
 Українська
 Română

