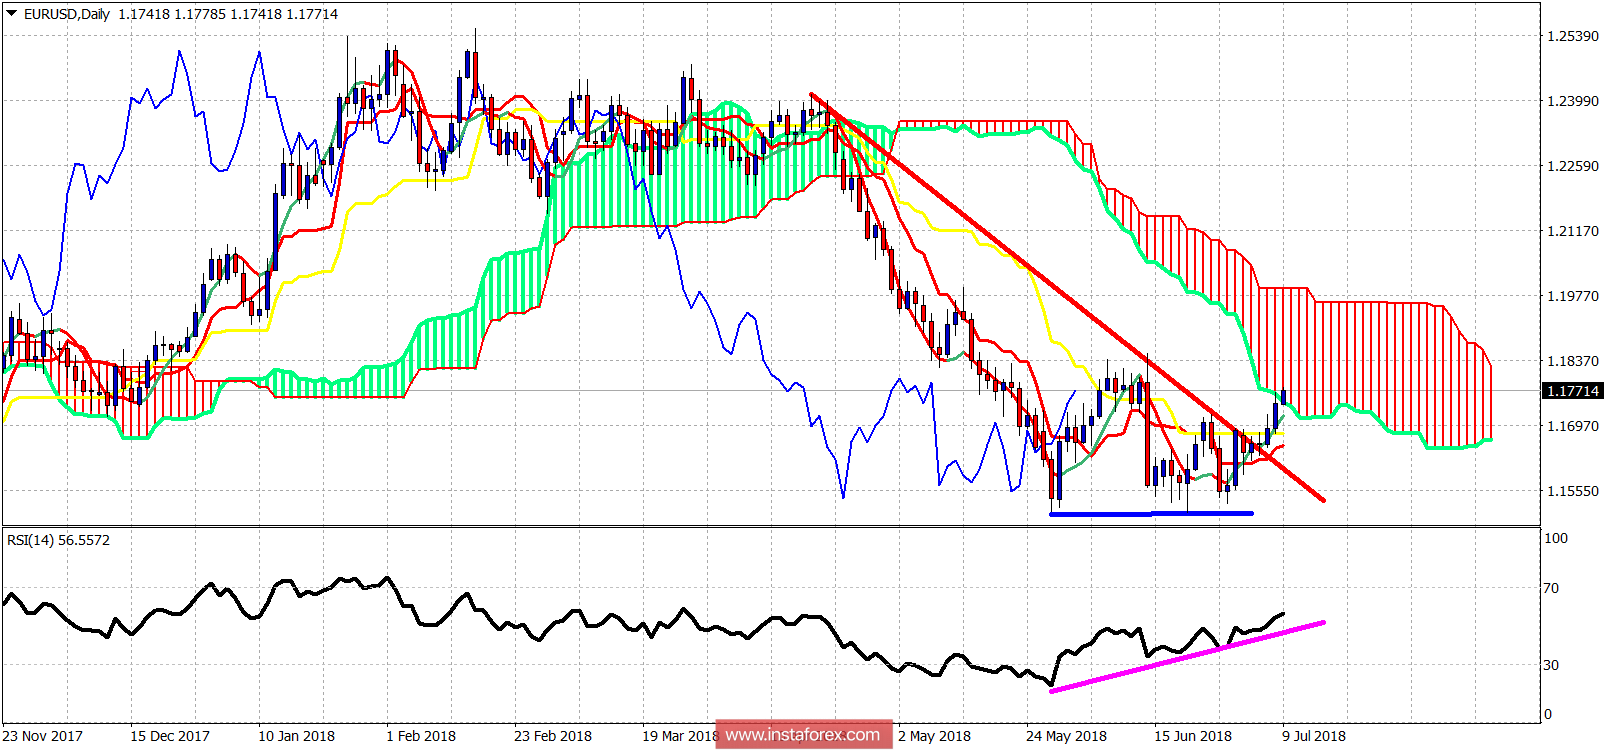
The EUR/USD pair continues moving higher as expected, after breaking above 1.1720. Short-term trend is bullish. Next important resistance and target area is at 1.1850-1.1830 as long as the price is above 1.1660.

Red line - resistance
Blue line - support
Magenta line - RSI support
The double bottom at 1.15 where support held is paying now. RSI is trending upwards supporting the bullish short-term trend. Rge price has broken above the resistance trend line and entered the Daily Ichimoku cloud. This has turned the daily trend to neutral from bearish. The short-term trend has turned bullish, because on the 4 hour time frame, the price is above the cloud. The short-term support is at 1.17 and the resistance is at 1.18-1.1830. Break above this area and we will move towards 1.19 which is the lower boundary of our longer-term bounce target area.
 English
 Русский
 Bahasa Indonesia
 Bahasa Malay
 ไทย
ไทย Español
 Deutsch
 Български
 Français
 Tiếng Việt
 中文
中文 বাংলা
বাংলা हिन्दी
 Čeština
 Українська
 Română

