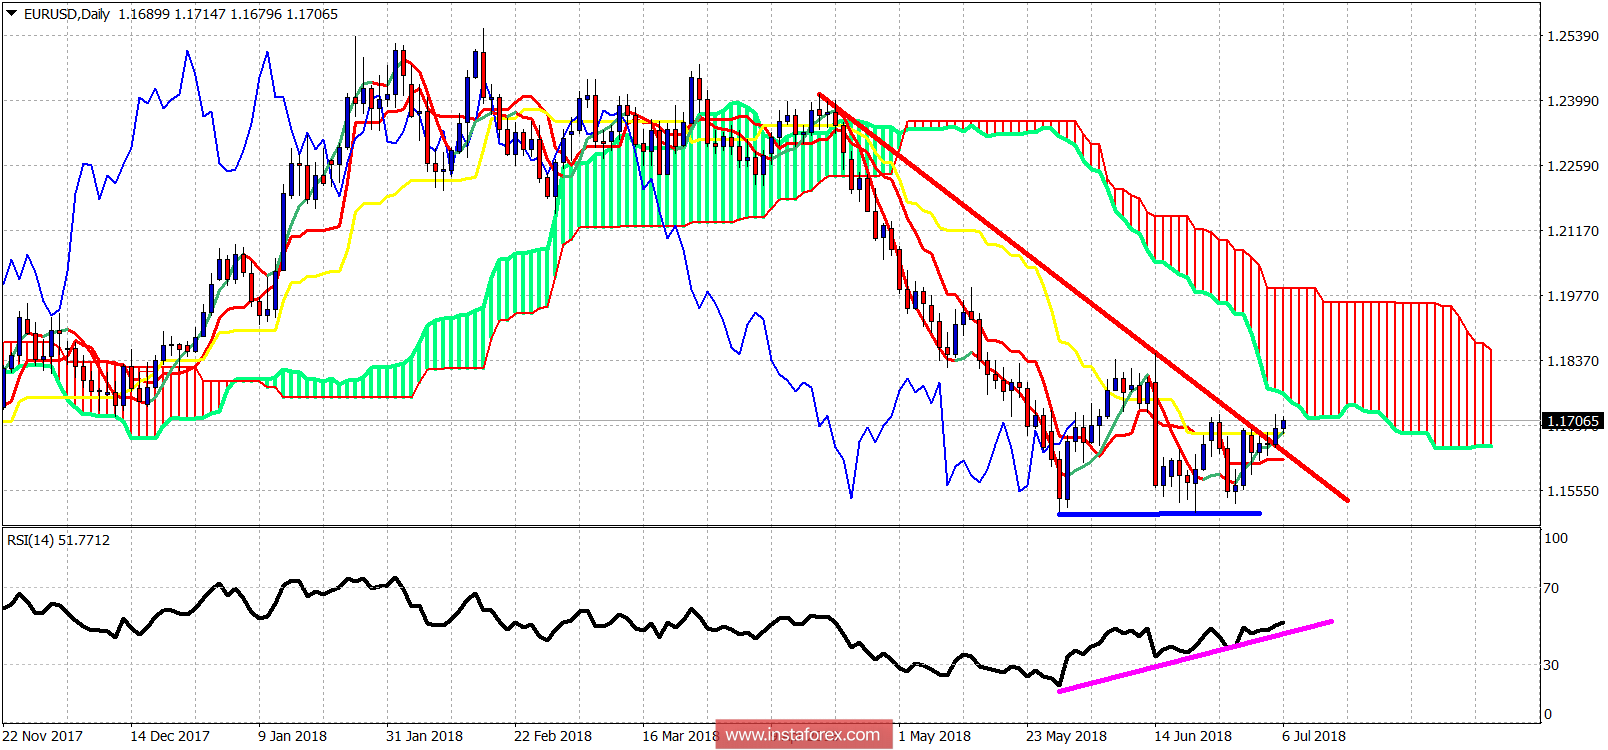
EUR/USD has broken above the downward sloping red trend line resistance and is challenging recent highs. Trend is bearish as the price remains below the Ichimoku cloud. Today's NFP announcement will provide the market with some volatility. A sustained move above 1.17-1.1750 will be bullish for the pair.

Blue line - support
Magenta line - RSI Support trend line
EUR/USD is making higher highs and higher lows on the Daily chart. Resistance is at 1.1720-1.1750. Support is at 1.1660 and next at 1.1610. A rejection at the 1.17-1.1750 area would be a bearish sign. Bulls need to break above this area and stay above 1.1750 if they expect to move higher towards 1.20. A break below 1.1660 will increase the chances of the price breaking below 1.15 next week.
 English
 Русский
 Bahasa Indonesia
 Bahasa Malay
 ไทย
ไทย Español
 Deutsch
 Български
 Français
 Tiếng Việt
 中文
中文 বাংলা
বাংলা हिन्दी
 Čeština
 Українська
 Română

