 English
  Русский
 Bahasa Indonesia
 Bahasa Malay
 ไทย
ไทย Español
 Deutsch
 Български
 Français
 Tiếng Việt
 中文
中文 বাংলা
বাংলা हिन्दी
 Čeština
 Українська
 Română

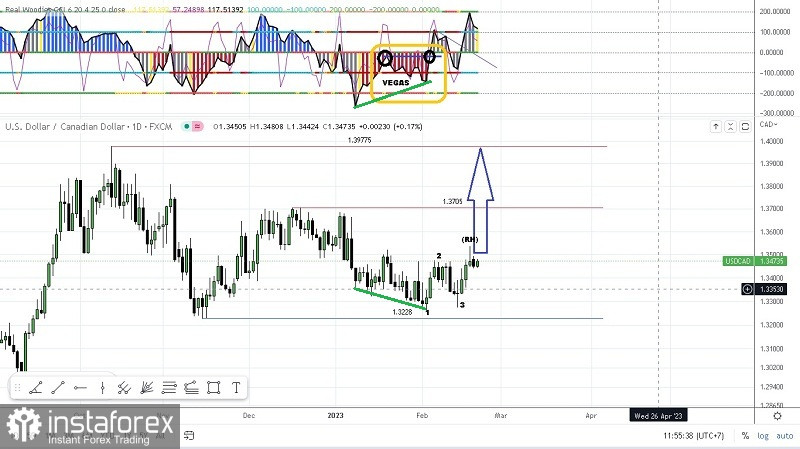
If we look on the daily chart of USD/CAD commodity currency pairs there is a few interesting things as follows:
1. The appearance of Bullish 123 pattern followed by Ross Hook (RH),
2. There is a deviation between price movement with CCI indicator.
3. The appearance of Vegas pattern on CCI Histogram indicator (20).
4. Both Sidewinder indicator in green which means Volatile/ really trending.
5. Chopzone indicator in Blue/Cyan which means = Bullish Trend.
6. Zero Line indicator in green which means Bullish.
Based on 6 facts above we can conclude that if The Loonie now is in a healthy Bullish condition so that in the nearest time Ross Hook 1.3537 will try to break by this commodity currency pairs, as long as there is no downward correction beyond the 1.3228 level, USD/CAD has the potential to appreciate to the 1.3705 level as the first target and if the volatility and momentum at The Loonie is still sufficient to support the bull movement then it is possible that the 1.3978 level will become the second target.
(Disclaimer)