 English
  Русский
 Bahasa Indonesia
 Bahasa Malay
 ไทย
ไทย Español
 Deutsch
 Български
 Français
 Tiếng Việt
 中文
中文 বাংলা
বাংলা हिन्दी
 Čeština
 Українська
 Română

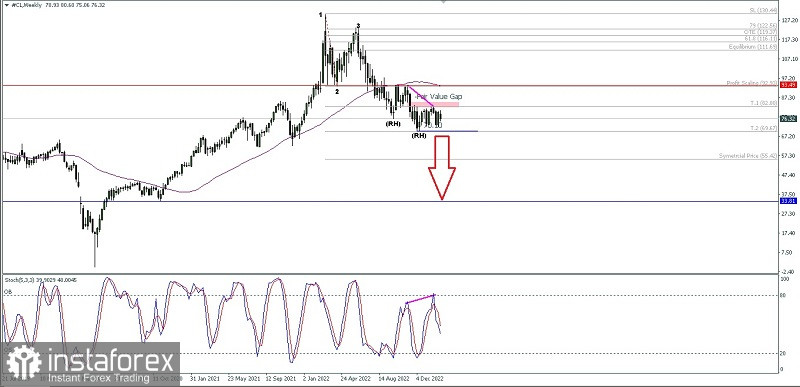
If we pay attention on the Crude Oil commodity asset weekly chart then there is a few interesting things :
1. There is a hidden deviation between price movement with Stochastic Oscillator indicator.
2. Price movement moves under Moving Average.
3. The appearance of Bearish 123 pattern followed with a few Ross Hook (RH).
Based on the three facts above, the crude oil commodity asset has the potential to depreciate downwards to test the 69.67 level. If this level is successfully broken down, the next level to aim for is 55.42 as the first target and if the momentum and volatility are supportive then the 33.81 level will be the target. both of them were on their way to the target levels previously described, there was no upward correction movement that exceeded the 89.83 level because if this level is successfully penetrated above, then all the scenarios previously described will become invalid and automatically cancel themselves.
(Disclaimer).